Gaussian Distribution
The normal distribution is a very common continuous probability distribution seen in statistics and Six Sigma methodology. It is sometimes informally called the bell curve, and the data set is described as being normally distributed.
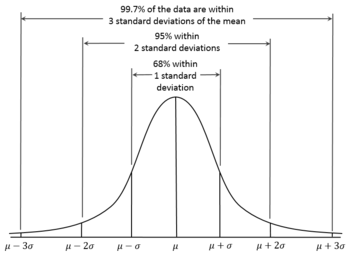
The normal distribution is symmetric about its mean, the area under the curve and over the x-axis is unity (i.e. equal to one), and the first inflection point occurs at one standard deviation away from the mean.
In addition, about 68% of values drawn from a normal distribution are within one standard deviation (σ) away from the mean, about 95% of the values lie within two standard deviations, and about 99.7% are within three standard deviations.
This fact is known as the 68-95-99.7 (empirical) rule, or the 3-sigma rule.
Therefore, a data set that is normally distributed will contain approximately 99.7% of the data within 3 standard deviations of the mean, which is a fundamental concept used in statistical process control (SPC).
Learn more about this distribution, watch this video using a Galton Board (or quincunx), developed by Francis Galton.
Links

Additional Resources
- Control Charts: A Basic Component of Six Sigma– creativesafetysupply.com
- Non-Normal Distributions in the Real World– blog.creativesafetysupply.com
- Learn from Six Sigma– blog.5stoday.com
- A Few Tools for Continuous Improvement– lean-news.com
- Implementing Six Sigma– hiplogic.com
- Design For Six Sigma (DFSS)– iecieeechallenge.org
- 5S The Best Lean Starting Point? Yep, And Here’s Why– 5snews.com
- Why Six Sigma Root Cause Analysis is a Great Tool– kaizen-news.com