p-value
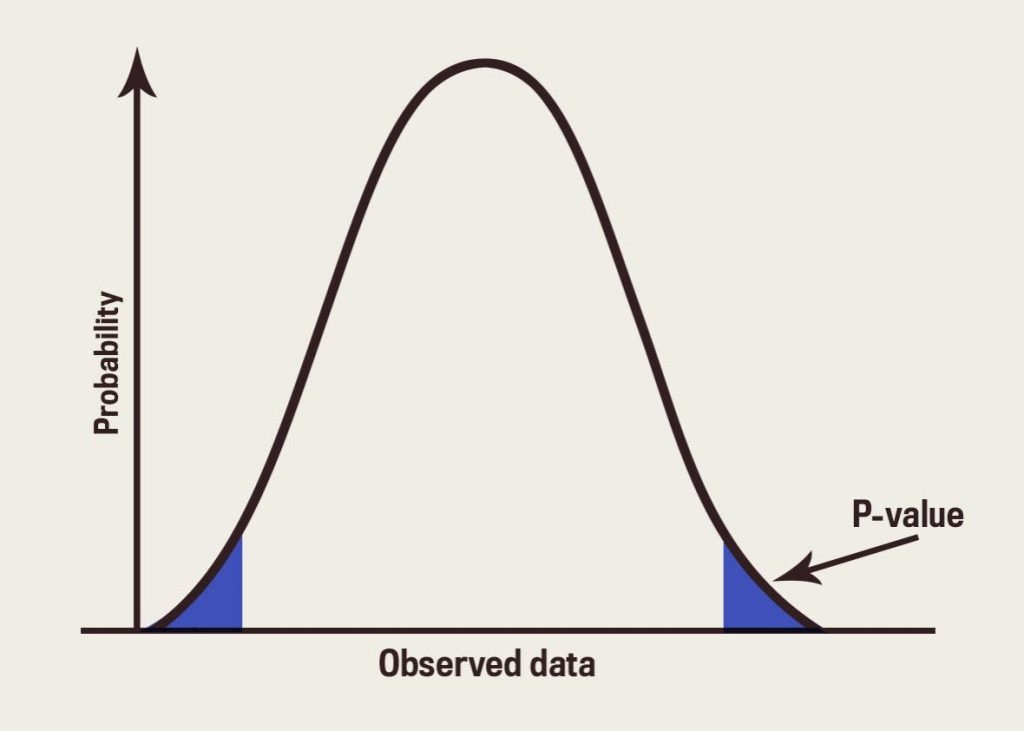
The p-value is a shortened way of writing the probability value. This is the calculated value that results from hypothesis tests, in order to decide if one or more groups differ statistically from each other.
You can compare means (averages), variation (standard deviations), proportion defective, and even medians to each other using hypothesis tests.
Hypothesis tests consist of two statements, a null and alternative hypothesis. The null hypothesis assumes all groups are equal to each other, and the alternative can state whether at least one group is greater than, less than or not equal to the other groups.
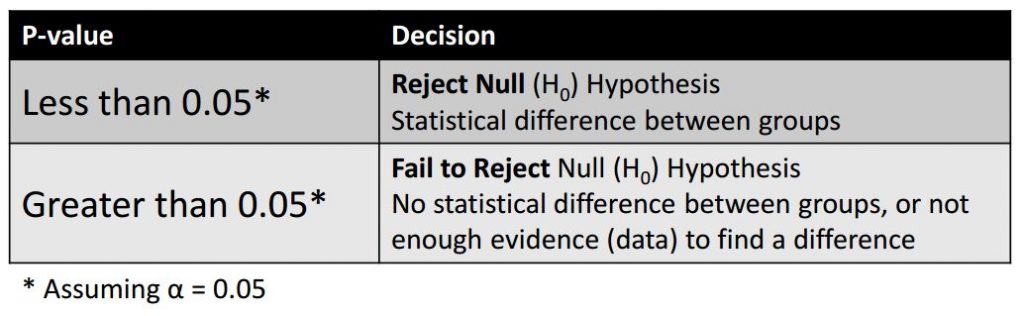
A p-value less than 0.05 is a rejection of the idea that the groups are similar to each other statistically (reject the null hypothesis).
A p-value greater than 0.05 means that you cannot reject the idea that the groups of data are similar to each other (fail to reject the null hypothesis). That means they are likely similar or come from the same original source (distribution), or that you don’t have enough data to statistically validate any differences that might exist.
If you p-value is between 0.05 and 0.10, it is recommended to gather more data to determine if you will eventually fall below 0.05 (reject null), or stay above 0.05 (fail to reject null).
An easier way to remember the decision of a hypothesis test is by using the phrase “when p is low, the null must go.”
Not all decisions are made based on 0.05, but it is a very popular cut-off threshold used and accepted in most scientific research and academic papers. Basically, if you make a decision to reject the null hypothesis with p-value of 0.04, then there is 4% chance that you could be incorrect with that decision. Taking less than 5% risk is considered acceptable in most situations, but for certain decisions, that might be too risky or too conservative.
P-value cut-off thresholds could be increased to 10% (0.10) when deciding on what color furniture to select in an office, or reduced below 1% (0.01) when deciding whether to invest $1 million to expand your facility based on anticipated growth projections.
Warning: When making a decision, you can cannot say “accept null” or “accept alternative.” You must select one of the two answers below:
- Reject the null hypothesis
- Fail to reject the null hypothesis
The calculation of p-value is complicated. It involves calculating the probability of obtaining a difference in mean or standard deviation from a distribution. Even the normal (gaussian) distribution formula is very complex, which is part of the confusion around p-values. It is best to use statistical software packages to calculate p-value, or use a Normal Distribution table or other distribution table for your particular hypothesis test.

Additional Resources
- Control Charts: A Basic Component of Six Sigma– creativesafetysupply.com
- Non-Normal Distributions in the Real World– blog.creativesafetysupply.com
- The Improvement Kata: Part 2– lean-news.com
- Why is it Important to know the Difference between Vapors and Fumes?– safetyblognews.com
- Let’s Discuss (VOC) Voice of Customer– blog.5stoday.com
- A Kaizen Story– kaizen-news.com
- Change Your Company Through Strategic Thinking– 5snews.com
- Creating Arc Flash Labels– babelplex.com
- Lean Way to the Danger Zone– jakegoeslean.com